


Spatially resolved untargeted metabolomics profiling reveals global metabolic adaptation from postnatal day 14 to day 28
To investigate whether the weaning period is associated with global metabolic changes in the brain, we analyzed sagittal brain sections from mice at postnatal day 14 (one week before weaning from maternal milk) and postnatal day 28 (one week after weaning onto standard chow) (Fig. 1A). Brains were rapidly flash-frozen, cryosectioned at 20 µm thickness, and mounted onto indium tin oxide (ITO)-coated slides for mass spectrometry imaging (MSI). This technique uses a laser to desorb and ionize molecules directly from the tissue, generating mass spectra with spatial resolution, enabling simultaneous mapping of metabolite localization and relative abundance across tissue regions15,16. While samples were processed with minimal delay to preserve metabolite integrity, it is important to note that these are postmortem tissues. Transient metabolic activity can persist after death and may affect the abundance of labile metabolites17. We then delineated major anatomical regions including cortex, corpus callosum, hippocampus (including dentate gyrus), dentate gyrus only, thalamus, striatum, midbrain, cerebellar cortex, pons, and medulla (Fig. 1B). The resulting ion images not only highlight these different anatomical regions but also revealed striking metabolic differences between the two developmental stages, indicating broad spatial and temporal remodeling of brain metabolism during the weaning transition. Putative annotations indicated decreased taurine (m/z 124.01) and myristic acid (m/z 227.21) from postnatal day 14 to 28, and increased levels of ceramide phosphate (m/z 644.51) and a lipid likely representing phosphatidylethanolamine or phosphatidylcholine (m/z 726.55). An untargeted analysis of these changes between developmental timepoints using MetaboAnalyst revealed a clear separation between postnatal day 14 and day 28 brains by sparse Partial Least Squares Discriminant Analysis (sPLS-DA) (Fig. 1C)18,19. When analyzing the individual brain regions separately, samples from postnatal day 14 and day 28 still clustered distinctly, although regional variation was evident (Fig. 1D). Pons and medulla samples from day 14 cluster more toward day 28 samples, potentially reflecting the faster maturation trajectory of these phylogenetically older caudal brain regions20. To identify the metabolites contributing to these separations in the sPLS-DA, we generated volcano plots for each region, which revealed numerous mass peaks significantly enriched at either day 14 or day 28 (Fig. 1E). Automated peak annotation putatively assigned many of these as lipids and metabolites related to central energy metabolism. Further unsupervised sub-clustering of the lipid-associated peaks revealed extensive changes in the corpus callosum and thalamus, while only minor changes were observed in the pons, midbrain and medulla between postnatal day 14 and 28 (Fig. S1). Among the most significantly altered lipid classes were sphingolipids, fatty acids, glycerolipids, and glycerophospholipids. Together, these data reveal robust, regionally distinct shifts in both lipid and energy metabolite composition between pre- and post-weaning stages across multiple anatomical brain regions.

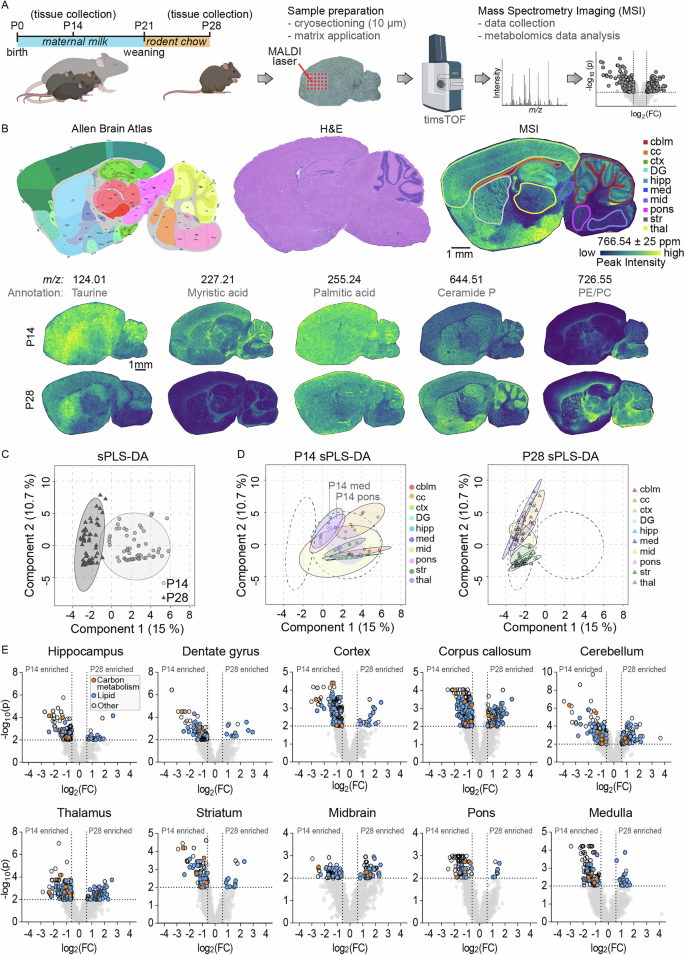
A Experimental timeline depicting brain collection from P14 pups nursing on maternal milk and from P28 littermates weaned onto standard rodent chow. Samples were sagittally sectioned and prepared for mass spectrometry imaging (MSI) followed by untargeted metabolomics analysis. B Indicated regions of interest outlined on the brain sections according to the Allen Brain Atlas (left), H&E stain (middle), and MSI (right), with representative MSI images shown for P14 (top) and P28 (bottom) brains with putative metabolite annotations. C Sparse partial least squares discriminant analysis (sPLS-DA) of untargeted metabolomic data from all brain regions, showing separation of P14 (light circles) and P28 (dark triangles) data. D sPLS-DA results separated by brain region, illustrating metabolic profiles at P14 (left) and P28 (right). E Untargeted metabolomic comparisons between P14 and P28 samples using MetaboAnalyst for each brain region. Peaks with lipid annotations are highlighted in blue, peaks associated with carbon metabolism are shown in orange. cblm cerebellum, cc corpus callosum, ctx cortex, DG dentate gyrus, hipp hippocampus, med medulla, mid midbrain, str striatum, thal thalamus. N = 6 P14 (4 female, 2 male) and 6 P28 (4 female, 2 male).
Targeted metabolic analysis reveals region-specific remodeling of core energy and biosynthetic pathways during the weaning transition
Given that central energy metabolism was altered in the untargeted analysis, we next investigated the associated pathways in detail using a more targeted analysis. Representative MSI images of selected metabolites are shown in Fig. 2A. Key differences appeared in pathways of central carbon metabolism between postnatal day 14 (center axis) and day 28 (grey circles), including glycolysis, the pentose phosphate pathway, and the TCA cycle (Fig. 2B). A detailed region-specific analysis revealed striking patterns including putatively-assigned glycolytic intermediates glyceraldehyde-3-phosphate/dihydroxyacetone phosphate (GAP/DHAP), bisphosphoglycerate (bPG), phosphoglycerate (PG), and phosphoenolpyruvate (PEP) being increased in cortex, with similar increases for GAP/DHAP and bPG in dentate gyrus and hippocampus, and selective bPG increases in thalamus and cerebellum (Fig. 2B and S2A). In contrast, these metabolites remained largely unchanged or even showed slight decreases in phylogenetically older and white matter-rich regions, such as the corpus callosum, pons, midbrain, and medulla (Fig. 2B and S2A). Among intermediates putatively assigned to the pentose phosphate pathway, we observed robust increases in pentose phosphates across nearly all regions, except corpus callosum and pons where levels remained unchanged, while erythrose-4-phosphate showed more modest or regionally variable increases. On the other hand, many TCA cycle metabolites, including putative (iso)citrate and α-ketoglutarate, decreased in most brain regions with less pronounced reductions in fumarate and malate. The strongest decreases were generally observed in cortex, thalamus, dentate gyrus, hippocampus, and cerebellum, whereas pons showed minimal changes (Fig. 2B and S2A).

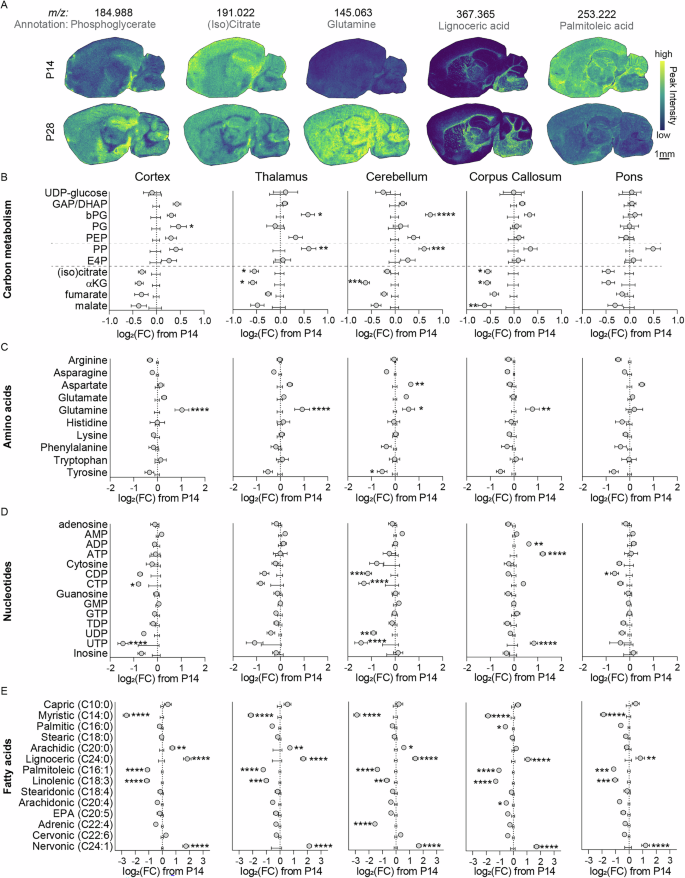
A Representative mass spectrometry images of P14 (top) and P28 (bottom) brain sections showing ion intensities of selected metabolites of interest. B–E Targeted metabolomic analysis of cortex, thalamus, cerebellum, corpus callosum, and pons. These regions are drawn from the same brains and MSI datasets. Data from P28 brains (grey circles) were plotted relative to P14 ion intensities for metabolites from carbon metabolism (B), amino acids (C), nucleotides (D), and fatty acids (E). *p < 0.05, **p < 0.01, ***p < 0.001, ****p < 0.0001 by individual t-tests, with Holm-Šidák multiple comparison correction. N = 6 P14 (4 female, 2 male) and 6 P28 (4 female, 2 male). GAP/DHAP glyceraldehyde-3-phosphate/dihydroxyacetone phosphate, bPG bisphosphoglycerate, PG phosphoglycerate, PEP phosphoenolpyruvate, PP pentose phosphates, α-KG α-ketoglutarate.
To further explore related biosynthetic and catabolic pathways, we also examined putatively assigned amino acids and nucleotides. Among amino acids, glutamine levels increased in cortex, thalamus, cerebellum, corpus callosum, dentate gyrus, hippocampus, and striatum, but remained unchanged in pons, midbrain, and medulla. Aspartate and asparagine were selectively increased in cerebellum and showed mild increases in thalamus and pons, while tyrosine tended to decrease in multiple regions, most notably in cerebellum (Fig. 2C and S2B). For putative nucleotides, CDP, CTP, and UTP levels decreased broadly across brain regions, with the notable exception of the corpus callosum, where CDP and CTP were maintained and UTP was even increased. UDP trended downward in most regions but was unchanged in corpus callosum and pons. Additionally, corpus callosum uniquely displayed increased ADP and ATP levels, whereas these nucleotides were largely stable elsewhere (Fig. 2D and S2C).
Lastly, changes in putative fatty acid composition were broadly consistent across brain regions (Fig. 2E and S2D). We observed decreases in myristic acid (14:0), palmitoleic acid (16:1), and linolenic acid (18:3) in all regions, as well as regional decreases in arachidonic acid (20:4, corpus callosum and medulla) and adrenic acid (22:4, cerebellum). In contrast, increases were detected in arachidic acid (20:0, cortex, thalamus, cerebellum, dentate gyrus, hippocampus, and midbrain), lignoceric acid (24:0, cortex, thalamus, cerebellum, corpus callosum, pons, hippocampus, striatum, with a trend in medulla), and nervonic acid (24:1, cortex, thalamus, cerebellum, corpus callosum, pons, hippocampus, striatum, midbrain, and medulla).
Together, these results highlight distinct region-specific metabolic signatures during the transition from postnatal day 14 to 28, including selective increases in glycolytic intermediates and pentose phosphates, global decreases in TCA cycle metabolites, differential changes in amino acid and nucleotide pools, and a widespread remodeling of fatty acid composition.
Region-specific glucose tracing reveals preserved pathway flux during postnatal brain maturation
To investigate metabolic flux rates rather than relative steady-state metabolite levels, we next performed stable isotope tracing in acute hippocampal brain slices. 450-µm-thick acute brain slices containing the entorhinal cortex and hippocampus were submerged in a physiological chamber with constant flow of oxygenated artificial cerebrospinal fluid in the absence or presence of uniformly labeled 13C6-glucose, allowing us to track downstream 13C incorporation in different hippocampal regions (cortex, dentate gyrus, and white matter/alveus) in mice aged postnatal day 14 and 28 (Fig. 3A). We first verified that the metabolite changes we previously observed in the brain at these ages are mirrored in the slices, confirming that the slice system accurately reflects in vivo metabolic states. As expected, the ex vivo slices recapitulated the observed increases in glycolytic intermediates and decreases in TCA cycle intermediates from day 14 to day 28 (Fig. 3B–D, left). We then analyzed the main isotopologues detected only in 13C6 glucose-treated tissue, but not in the unlabeled controls, allowing us to assess its incorporation into glycolysis, the pentose phosphate pathway, and the TCA cycle. Glycolytic intermediates approached a (pseudo) steady-state labeling within 30 minutes, with approximately 40-70% average 13C incorporation across all analyzed regions (somewhat consistent with previous NMR studies, showing maximal 13C-glucose incorporation into TCA cycle intermediates already after around 15 minutes21). Pentose phosphate intermediates reached a steady-state labeling level within 10 minutes in the cortex (approximately 40% labeling efficiency), but labeling was delayed ( > 30 minutes) in the dentate gyrus and alveus (Fig. 3B–D). TCA cycle intermediates were predominantly labeled in the first round (meaning that M + 2 isotopologues were predominant), with (iso)citrate showing the highest labeling (50-60% in all regions), whereas α-ketoglutarate and malate showed lower labeling (approximately 10-20% in all regions, with malate labeling below 5% in white matter (Fig. 3B–D). Importantly, labeling dynamics did not differ between slices from 14- and 28-day-old mice, indicating that although metabolite levels change, the flux relative to pool size is constant. This suggests that pathway activity is scaled proportionally rather than fundamentally reprogrammed.

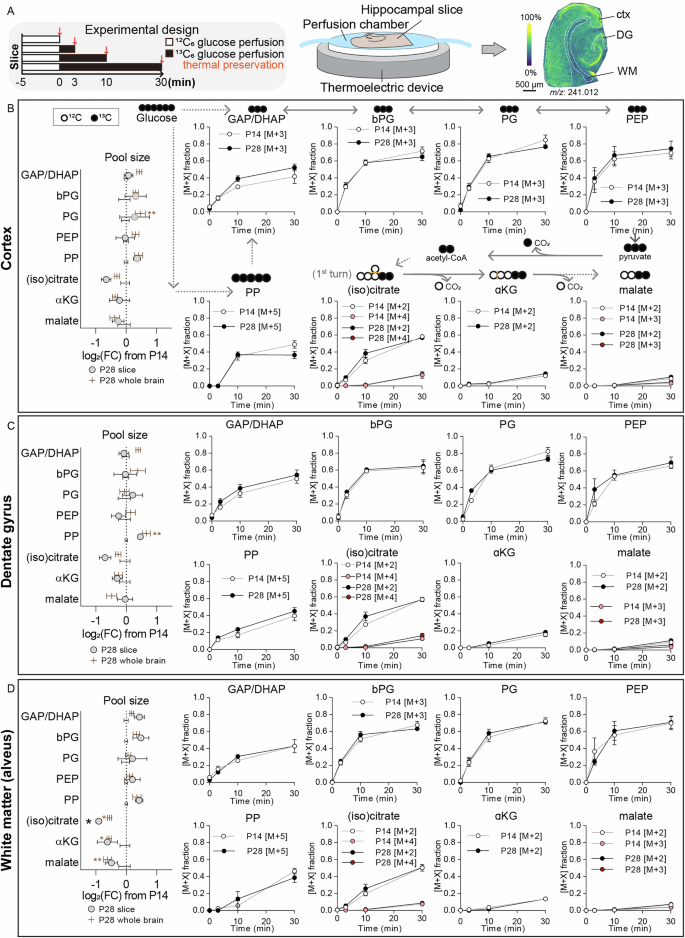
A Schematic of experimental setup: Acute hippocampal slices from postnatal day 14 or 28 mice were perfused for 0, 3, 10, or 30 minutes with artificial cerebrospinal fluid (aCSF) containing 13C6-glucose (black bars), followed by rapid thermal preservation and mass spectrometry imaging. B Labeling dynamics in the cortex. Metabolite labeling diagrams are shown above each graph, depicting 12C (open circles) and 13C (filled circles). Left panel compares relative metabolite pool sizes between P14 and P28 from slice data (grey circles) and previously shown data from flash-frozen whole brain (brown bars). Right panel plots isotopologue fractions [M + X] over time for P14 (white circles) and P28 (black circles) slices. Corresponding metabolite pool sizes and labeling dynamics are calculated for the dentate gyrus (C), and alveus (D). *p < 0.05, **p < 0.01 by individual t-tests, with Holm-Šidák multiple comparison correction. N = 6 P14 (4 female, 2 male) and 6 P28 (3 female, 3 male). GAP/DHAP glyceraldehyde-3-phosphate/dihydroxyacetone phosphate, bPG bisphosphoglycerate, PG phosphoglycerate, PEP phosphoenolpyruvate, PP pentose phosphates, α-KG α-ketoglutarate.
Brain metabolic remodeling during postnatal development is evident in gene expression profiles and remains unaltered by a milk-replacement diet
To explore whether our observed metabolic shifts are reflected at the transcriptional level, we analyzed publicly available mouse and human brain gene expression datasets. For comparison between datasets, we grouped samples into developmental windows: embryonic (mouse and human pre-birth), infancy (mouse postnatal day 0–13, human 0–6 months), childhood (mouse day 14–20, human 2–4 years), adolescence (mouse day 21–28, human around 5–12 years), and adult (mouse >28 days, human >12 years) and display data as a percentage of the maximum expression in that dataset (Fig. 4A)22,23,24,25,26. Although these data lack regional resolution, they revealed coordinated metabolic adaptations in both mice and humans. Specifically, glycolytic enzyme expression increased with age (Fig. 4B), while pentose phosphate pathway genes showed a slight decrease (Fig. 4C). Most TCA cycle genes either remained stable or increased, except for isocitrate dehydrogenase 1, which decreased in both species (Fig. 4D). Genes related to glycogen metabolism, β-oxidation, and ketolysis showed more heterogeneous regulation patterns (Fig. 4E–G). Finally, amino acid metabolism genes generally increased in mice and displayed more variable regulation in humans, though most trended upward (Fig. 4H). Collectively, these patterns suggest that transcriptional reprogramming of metabolic enzymes is tightly coordinated but not always directly proportional within or across pathways, highlighting the complex regulation of brain maturation at multiple levels of molecular organization. This prompted us to test whether our observed metabolic changes are driven by intrinsic developmental programs or shaped by extrinsic dietary cues during the weaning event. We therefore placed mice on a milk-replacement diet mimicking maternal milk composition. On postnatal day 21, mice were weaned either onto standard chow (62% carbohydrate, 25% protein, 13% fat) or onto a milk-replacement diet (77% fat, 18% protein, 5% carbohydrate; Figs. 5A and S3A). Body weight gain, tail length, and food intake were monitored, with no significant differences observed between the two groups, indicating comparable overall growth during the dietary intervention period (Fig. S3B-E). MSI analysis of brains collected at day 28 revealed that global metabolomic profiles of mice on the milk-replacement diet closely resembled those of chow-fed 28-day old mice littermates and were clearly distinct from 14-day old brains (Fig. 5B). Specifically, the characteristic increases in glycolytic intermediates, decreases in TCA cycle metabolites, and regional changes in amino acids and nucleotides we had previously observed (Fig. 2), were consistently observed regardless of diet (Figs. 5C-F and S4). Thereby, our quantitative analysis across different brain regions confirmed that the metabolic remodeling from day 21 to day 28 occurred independently of dietary macronutrient composition. Together, these findings demonstrate that postnatal brain metabolic maturation is robust and largely diet-independent, with similar trends evident already at the gene expression level.

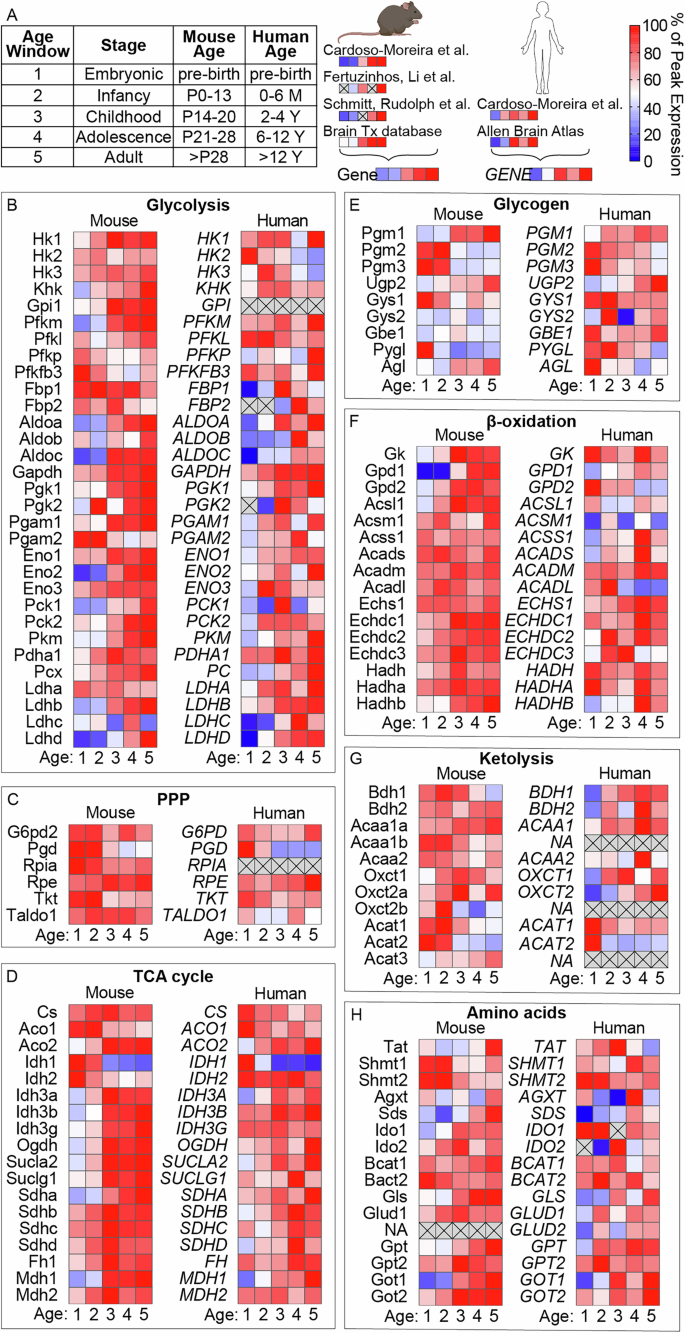
A Gene expression data were compiled from four independent transcriptomic datasets for mouse brain and two for human brain. To enable comparison across datasets, samples were grouped into developmental age windows and expression levels were normalized to the peak of expression of each gene within its respective dataset. Normalized gene expression profiles for key metabolic pathways across postnatal development: B glycolysis, C pentose phosphate pathway (PPP), D tricarboxylic acid (TCA) cycle, E glycogen metabolism, F β-oxidation, G ketone body metabolism (ketolysis), and H amino acid metabolism.

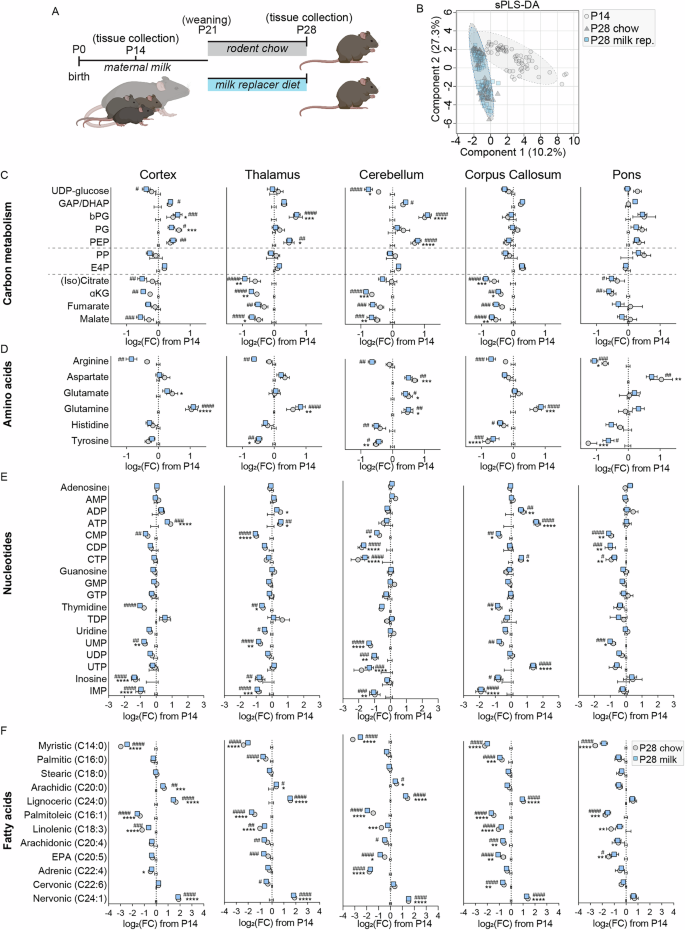
A Experimental design: Brains were collected at postnatal day 14 (P14) from pups nursing on maternal milk. Remaining littermates were weaned at P21 onto either standard chow or milk replacer diet and brains were collected at P28. B Untargeted metabolomic comparisons between P14 (light grey circles), P28 standard chow (dark grey triangles), or P28 milk replacer diet (blue squares) were visualized using sparse partial least squares discriminant analysis in MetaboAnalyst. C–F Targeted metabolomic analysis of the cortex, thalamus, cerebellum, corpus callosum, and pons. P28 standard chow (grey circles) and P28 milk replacer diet (blue squares) are plotted relative to P14 values for metabolites related to carbon metabolism (C), amino acids (D), nucleotides (E), and fatty acids (F). *p < 0.05, **p < 0.01, ***p < 0.001, ****p < 0.0001 by two-way ANOVA with Tukey multiple comparison correction. N = 7 P14 (4 female, 3 male), 7 P28 chow (3 female, 4 male) and 9 P28 milk replacer diet (6 female, 3 male); conducted as 3 separate experiments. GAP/DHAP glyceraldehyde-3-phosphate/dihydroxyacetone phosphate, bPG bisphosphoglycerate, PG phosphoglycerate, PEP phosphoenolpyruvate, PP pentose phosphates, α-KG α-ketoglutarate.
link